Triangular plot
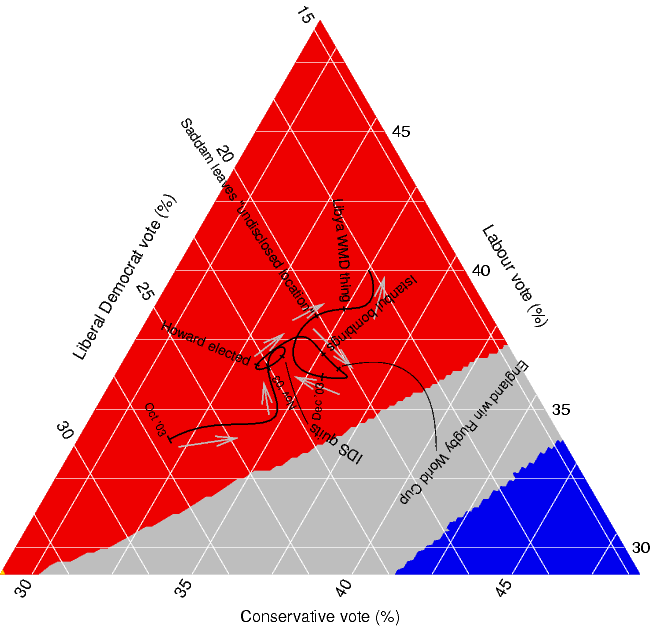
A triangular plot is used to illustrate the percentages of three components where the total percentage is 100%. This triangular plot depicts voting trends. The axes of the figure show the estimated fraction of the population intending to vote for each of the major parties.
No comments:
Post a Comment