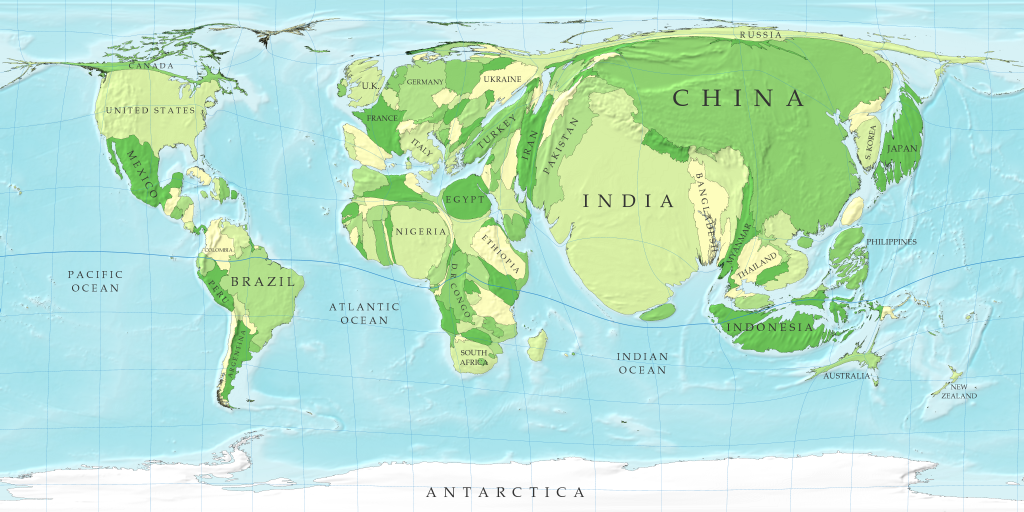
A cartogram is a map that shows a distorted image in order to display the information being given. Some examples are, population, GNP, child mortality, or energy use. This catogram displays each country's population by size of the country.
http://www-personal.umich.edu/~mejn/cartograms/
No comments:
Post a Comment