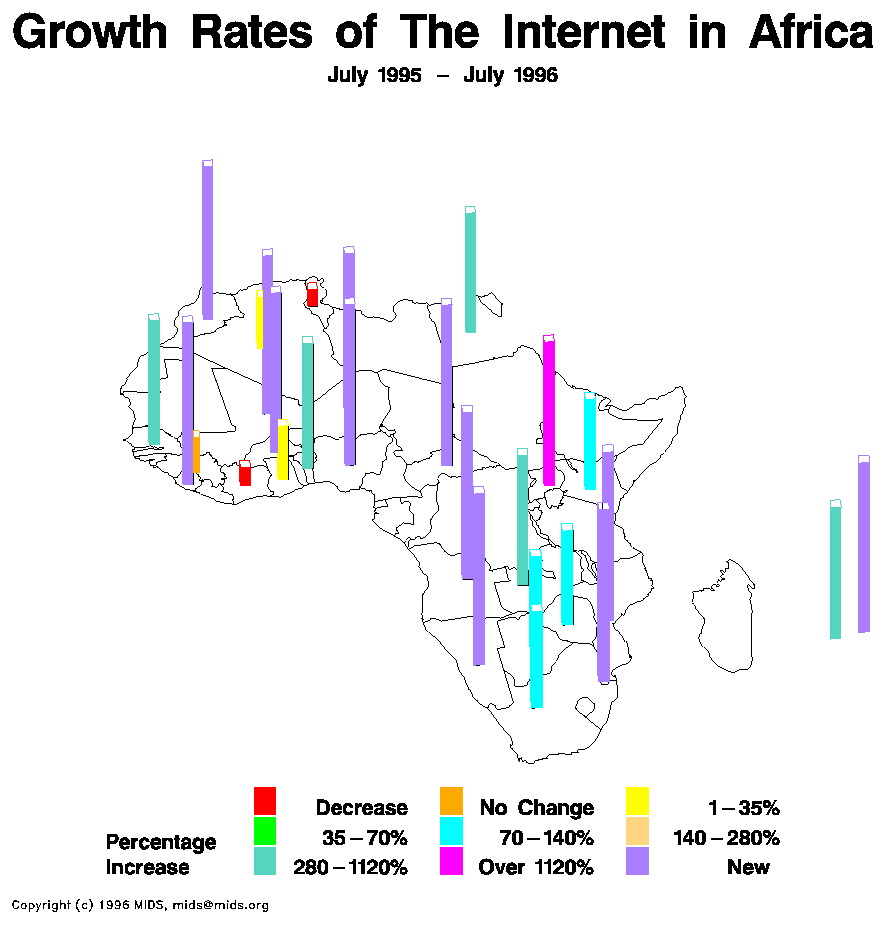
A statistical map is variation in quantity of a factor such as population, snow, or just about any kind of statistic is used in a geographic area. One example is a bar graph. This particular map uses bars in agreement with Internet growth rates in Africa during the mid 1990s.
 http://personalpages.manchester.ac.uk/staff/m.dodge/cybergeography/atlas/census.html

No comments:
Post a Comment