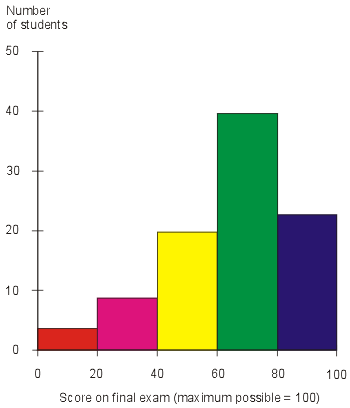
A histogram is a statistical graph that shows the frequency of values of a quantity by vertical rectangles of varying heights and widths. The width of the rectangles is in proportion to the class interval under consideration, and their areas represent the relative frequency of the item in question. This example, is a histogram showing the results of a final exam given to a hypothetical class of students. Each score range is denoted by a bar of a certain color.

No comments:
Post a Comment